We do a lot of Agile software development work for clients. Small teams. Big teams. .NET. Python. Java. Ruby. Lots of tooling. Minimal tooling. Startups. Large enterprises. One consistent challenge we’ve faced, especially in larger projects with big teams, is making sure everyone involved has accurate context and awareness about the state of the project as a whole. Getting everybody “on the same page” helps people recognize issues, communicate better, and make better tactical and strategic decisions. When people aren’t on the same page, they get surprised — and not in a “hey, surprise, it’s a birthday party for you” kind of way. These surprises cause confusion, stress, more work, and loss of confidence. No fun.
To avoid those unwanted surprises, we need context and transparency into different aspects of a project. And for context and transparency, my “go to” solution is the dashboard.
I decided this was worth tackling for one of our projects in the hopes of helping not only this project, but also learning how we could help other projects, too. The project has a large delivery team (around 20 people) and an extended group of stakeholders who care a lot about the project (e.g., Product Owners, program management). The team is also using multiple “single sources of truth” for different kinds of information — JIRA, Pivotal Tracker, TeamCity, and Confluence to name the big ones.
We started with identifying the areas of the project where we wanted to create more transparency. We wanted those areas to cut across the entire project, including management and engineering, to give the most comprehensive view possible. We decided the top priority areas for the first iteration of the dashboard were:
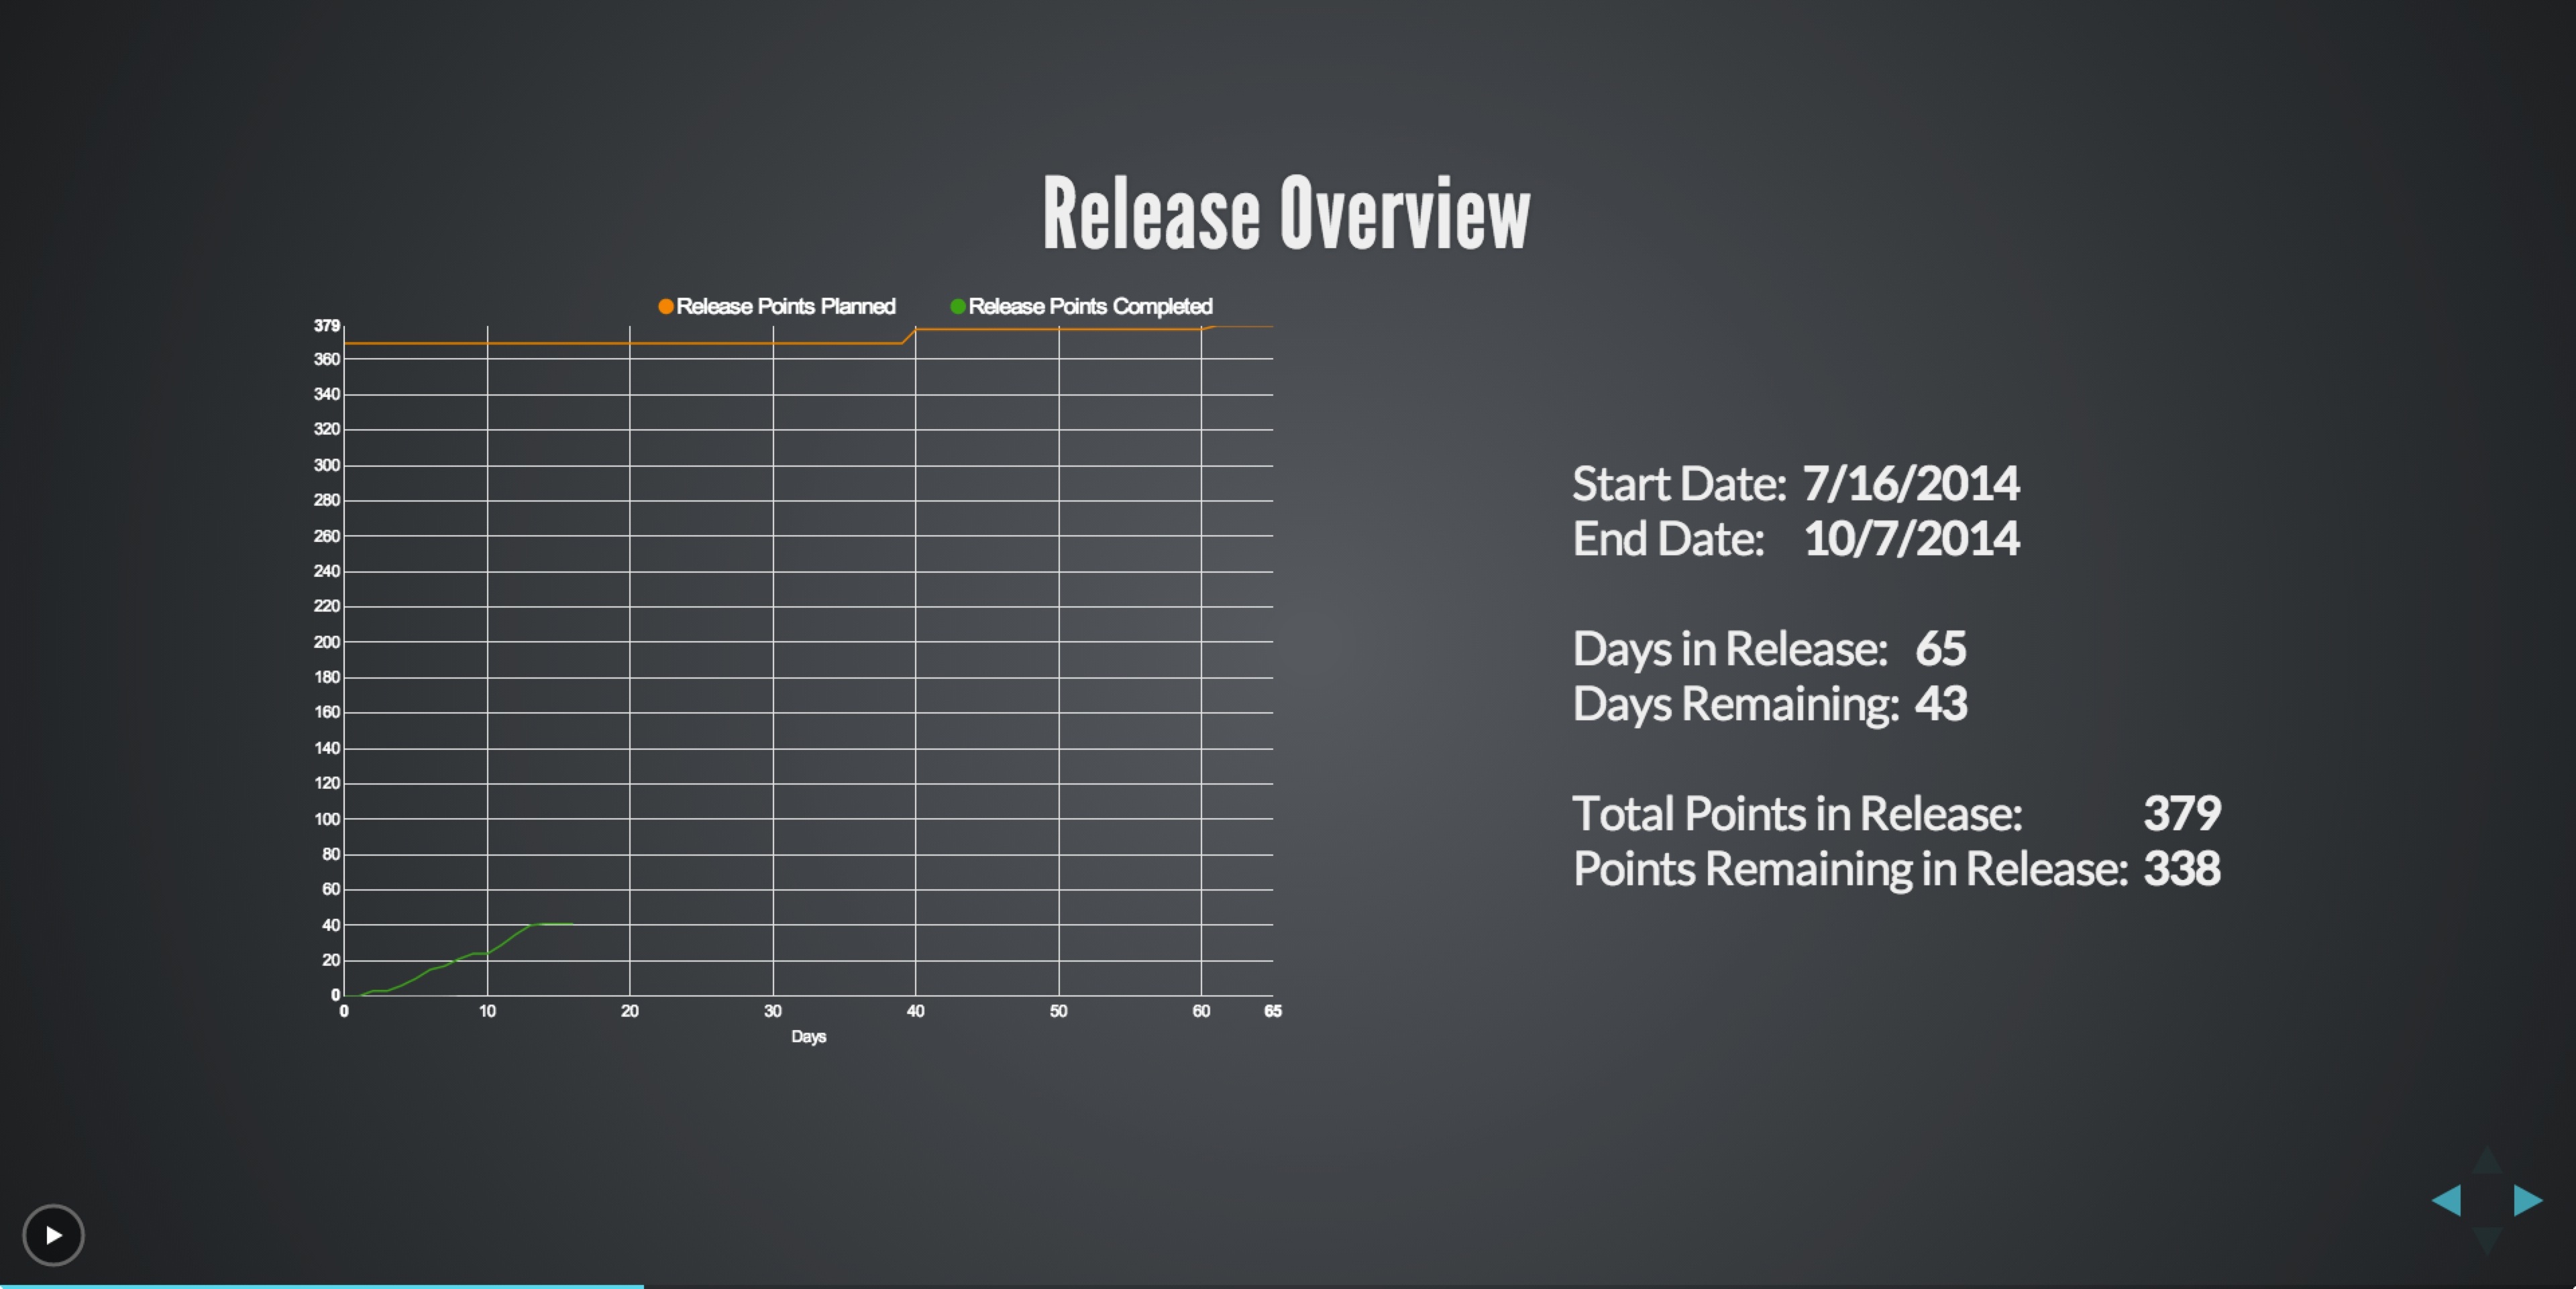
- Release burnup. How is our progress against the release goals?
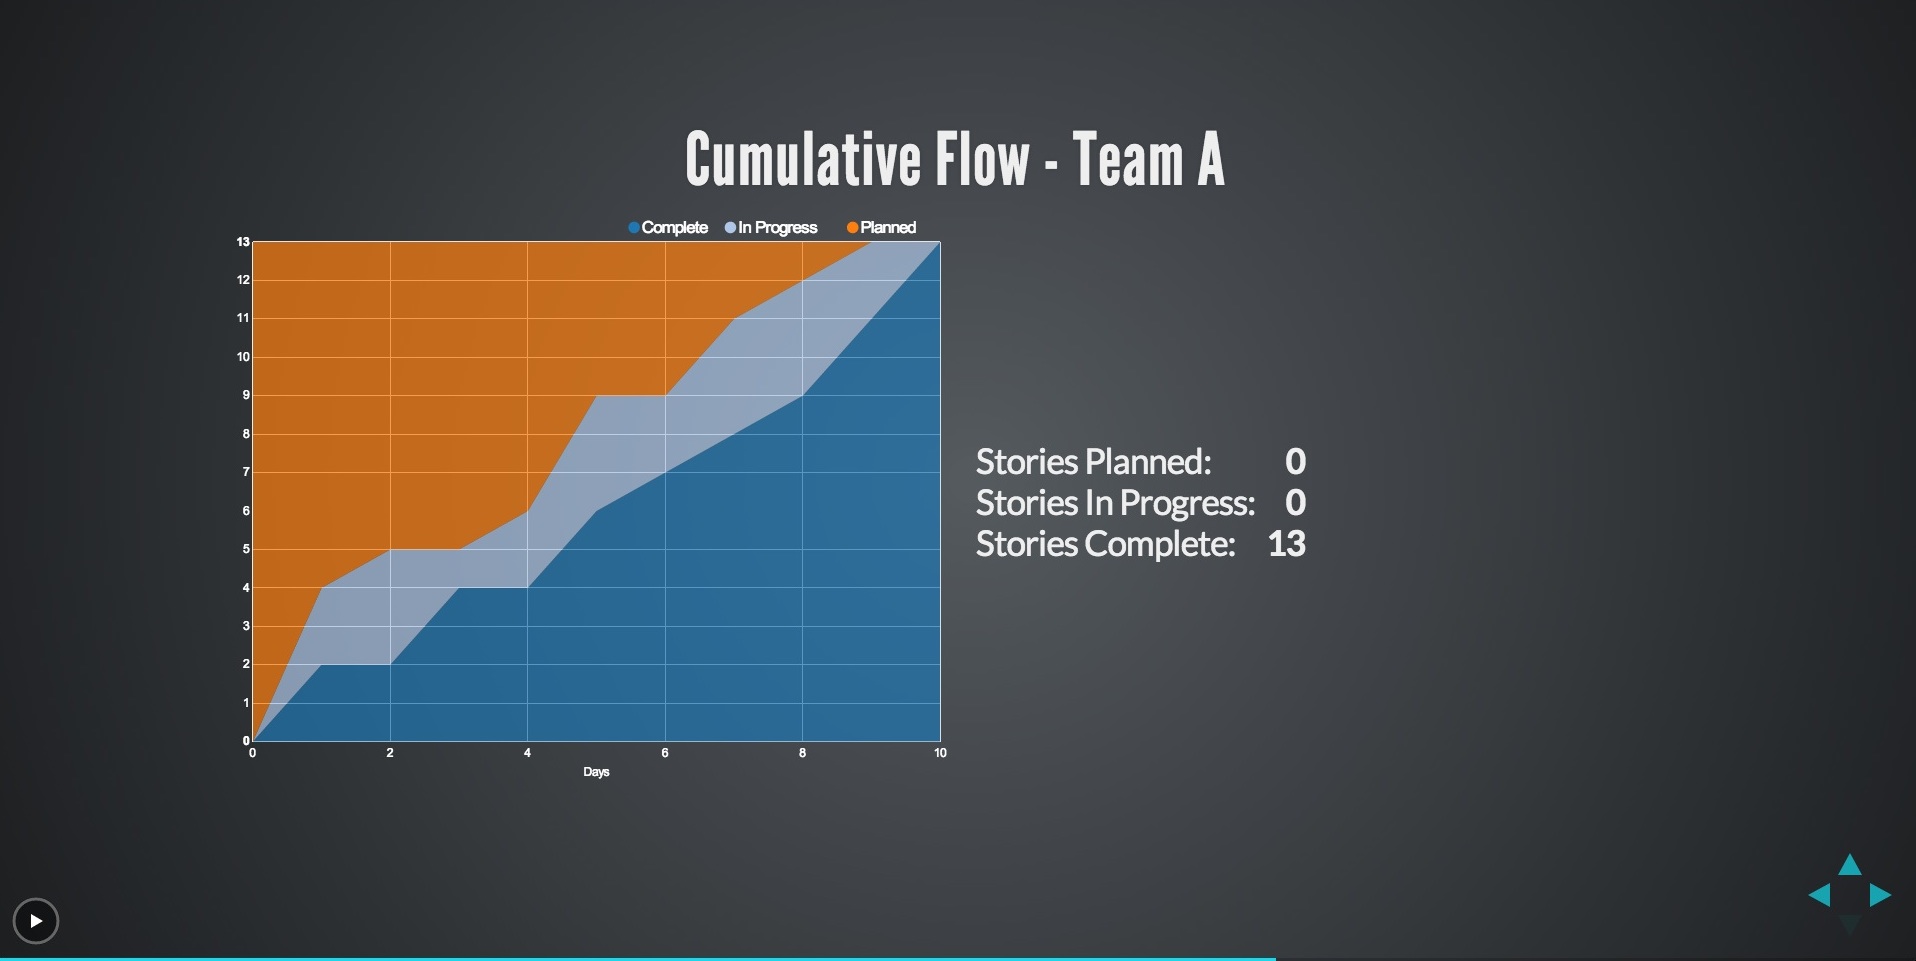
- Sprint status, including cumulative flow. How is our progress against the sprint goals? Are we limiting WIP?
- Automated testing metrics. How are we on quality?
- Build information. What builds live in what environments?
Once we had identified what information we wanted to include in the dashboard, my high-level design goals were:
- Provide the “at a glance” information for the project across management and engineering in one place and put it “in your face”. This is what creates the transparency.
- Easy/simple/quick to update. It can’t be a burden.
- Lightweight and reusable with minimal dependencies on the target environment. We want to use this in as many places as possible.
- Look good. Hey, aesthetics are important, too.
I wanted to find out what others had done so my first stop was Google. There had to be a readily available solution that I could configure and deploy quickly, right? What I found was a little disappointing. People generally addressed this transparency issue with dashboards in one of three ways:
- Leave the information in the “single source of truth” systems and make people go to them to get the information they need. Convenience, but not transparency — the information isn’t “in your face” like it should be.
- Use one tool as the “platform” and integrate information from the other tools into that one. Complex, time-consuming, brittle, and clunky.
- Roll your own. Sigh.
I talked to some of our teams and clients to find out what they were doing. Solutions ranged from Excel spreadsheets, SharePoint lists, Trello (awesome tool), to cobbled-together reports and charts from the “single source of truth” systems. I did see one really creative solution used by one of our clients. They used Raspberry Pi devices connected to flat-panel displays on the wall to automatically cycle through URLs for their key management and engineering metrics. So as long as the info you wanted to display was accessible via a browser, you could display it in the dashboard. I also looked at a handful of dashboard frameworks, including Dashing (thanks, Mike McGarr).
For a lot of reasons, I decided the best approach for us was “roll your own” using open source JavaScript frameworks, especially given that I wanted this to be reused by us and others. Here are the basic building blocks we settled on:
- Reveal.js. The basic presentation framework for the dashboard. It’s PowerPoint for developers.
- NVD3.js. Handles all the charting and graphing.
- Handlebars.js. A templating framework that helps keeps the code DRY.
Big thanks to Seph Coster for identifying all the building blocks and putting them together.
We wanted the first iteration to be cheap (free) and simple so we didn’t build all the features we imagined — really just an MVP. For example, we’re storing the dashboard data in separate JavaScript files and manually updating them until we get the dashboard to stick with the team. It was quick, but certainly not ideal. Eventually I’d like to automate the dashboard updates by hooking into the tool APIs. Our ScrumMaster and tech lead will thank me, I’m sure, since they’re the ones handling the dashboard updates right now.
Here are a few sample views of what we released.

My grand vision is to add more information areas to the dashboard, hook into the APIs for the “single source of truth” tools, and eventually build connections to different tools (e.g., CircleCI, Jenkins, VersionOne) to support more project environments.
Do you have good examples of project dashboards — Agile or otherwise? Do you have any suggestions for me as we refine the dashboard?
Would you use something like this if it were available to you open source?

Have you heard of SharpCloud? You can create live project dashboards / project reports from project data that can be accessed on tablets and phones, has an audit trail of all communication and can link to Sherepoint.
LikeLike
I checked out the product from your company. It looks interesting for the scenarios identified on the website, but it doesn’t look like a fit for what we’re trying to do with this.
LikeLike
[…] In this post, published on his blog “IT’s A Nice Life,” Co-Founder and Partner Jeff Gallimore explores this issue and the solutions needed to create clear, transparent communication via dashboarding that can keep you, your team, and your stakeholders on track. […]
LikeLike
[…] step in your workflow? Is there a manual task that could really benefit from automation? Is there information you could provide that would help with decision-making? Address those items first and get them fixed quickly. Get […]
LikeLike